
Version 1.4.4
The graphics functionality lost when using the Big Sur or higher operating system has been restored.
Version 1.4.3
Minor update with a new support site and a privacy statement
Version 1.4.2
Minor update.
Version 1.4.1
The program has been updated to a 64 bit application
Version 1.4.0
In this version this version the ability to read csv files has been added. Therefore if simple two column excel file is saved as a csv file, it can be opened via the file menu by selecting "Open csv file".Version 1.3.0
In this version the App has been sandboxed and the ability to remove individual data rows from the input data has been added.
Description
This program fits initial rate data for enzyme catalyzed reactions to the equation below using the method of Wilkinson, G.N. (1961) Biochem. J. 80, 324-332.kcat(obs)=kcat So/(So+Km)
Data can be inputted and fitted as initial rates. Fitted values of Vm, Km and Vm/Km are outputted. If the enzyme concentration is known it can be inputted and values of kcat and kcat/Km calculated.
Data can also be inputted in the form of Abs/min and if the molar extinction is inputted then the Abs/min will be converted to d[P]/dt=v(obs) in M/min. Data can then be converted to M/sec and fitted. Initial rates are often very small numbers and so to ensure numerical accuracy you can multiply your data by the scaling factor of your choice before fitting the data.
Or the initial rates can be divided by the enzyme concentration to give kcat(obs) which can then be fitted.
When fitting without estimates, a linear Lineweaver-Burk plot is used to make the initial estimate of kcat and Km. In this case usually, one iteration using the Wilkinson method usually gives the best fit. Please note the Lineweave-Burk method is only used to make the initial estimate, the final outputted fit is always by the Wilkinson method.
If the initial Lineweaver-Burk plot does not give good estimates of kcat and Km you can enter your own estimates and then fit by the Wilkinson method using your own estimates of kcat and Km. Doing more iterations does not necessarily improve the fit obtained.
Results can printed, saved as a text document or copied and pasted into other applications such as Word.
The iphone app EnzymeQA contains key facts in enzymology and should help you check you have used the appropriate conditions for determining catalytic constants.
Specific instructions:-
FIRST INPUT DATA OR OPEN SAVED DATA
Buttons will be enabled as you need them.
Test data
S----v(obs)
0.2--0.9
1----3.5
2----5
3----6
5----7.5
7----8
Enter data into the boxes "Substrate concentration" and v(obs)
Press button "Add Data"
Enter data into the boxes "Substrate concentration" and v(obs)
Select button "Add Data"
Repeat until all data is entered.
A minimum of 3 data points are required but you should use at least 5 data points covering the range Km/5 to 5Km.
Then you can save the data as a text file by selecting the "Save data" button.
You can delete the data by selecting the "Delete data" button.
You can then reload the saved data at any time by selecting the "Open saved data" button.
To delete an individual data row you must first enter the ID number of the row you wish to delete in the box opposite the "Delete data row" button. When you click on the "Delete data row" button the row will be deleted and a new set of ID numbers will be generated.
TO ANALYZE DATA
Select "Fit without estimates" Usually this will give a good fit.
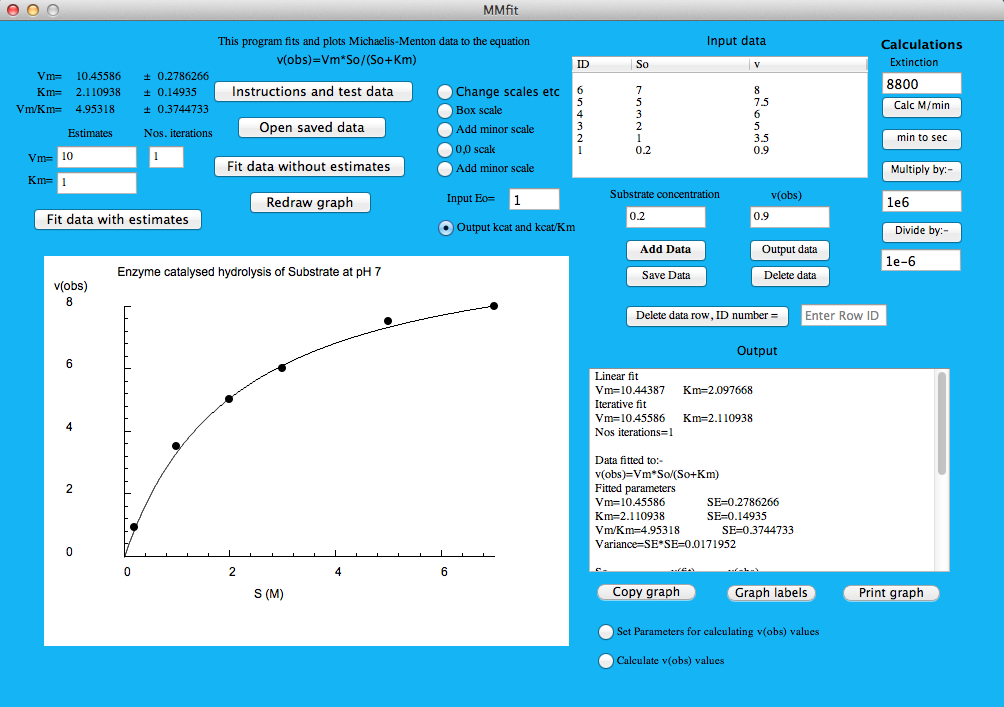
Answers for test data:
Vm = 10.45 ± 0.28
Km =2.11 and ± 0.15
Vm/Km = 4.95 ± 0.37
However with poor data the fit with estimates option may be needed. This option will now be available. In this case you must submit good estimates for a reasonable fit.
The analyzed data, fitted data and estimates of catalytic parameters will be outputted to the Output window. This output can be selected, printed or copied and pasted into other applications such as word. These options will be found under the File and Edit menus.
Select "Change scales. After changing the graph scales, press redraw to implement the changes.
You do not need to do anything for the test data. Simply close the "Change scales etc" window and then press "Redraw".
To give the graph a title and label the axes select "Graph labels" and make the appropriate changes.
AFTER CHANGING THE GRAPH SCALES, AXES OR LABELS PRESS "REDRAW" TO IMPLEMENT THE CHANGES.
Select "Print graph" to output the graph to your printer
Select "Copy graph" to copy the graph to the clipboard. You may then paste it into other applications such as Word.
If you want to calculate theoretical data you can select " Set parameters for calculating kcat(obs) values" enter values, then select "Calculate kcat(obs) values" to output the data to the output window.
If you have any questions please contact
jpgmprograms@gmail.com
TEST data
Substrate conc v(obs)
0.2 0.9
1 3.5
2 5
3 6
5 7.5
7 8
Fitted parameters
Vm=10.45586 SE=0.2786266
Km=2.110938 SE=0.14935
VmKm=4.95318 SE=0.3744733
Variance=SE*SE=0.0171952