Version 1.3.2
The graphics functionality lost when using Big Sur or higher operating systems has been restored.
Version 1.3.1
Minor update with a new support site and a privacy statement
Version 1.2.1
The program has been updated
to a 64 bit application. Buttons have been introduced which allow you
to quickly delete parameters you do not require.
Version 1.2.0
In
this version the ability to read csv files and tab delimited text files
has been added. Icons and Screenshots have been updated.
Version 1.1.0
The user can now delete individual rows from data files.
Description
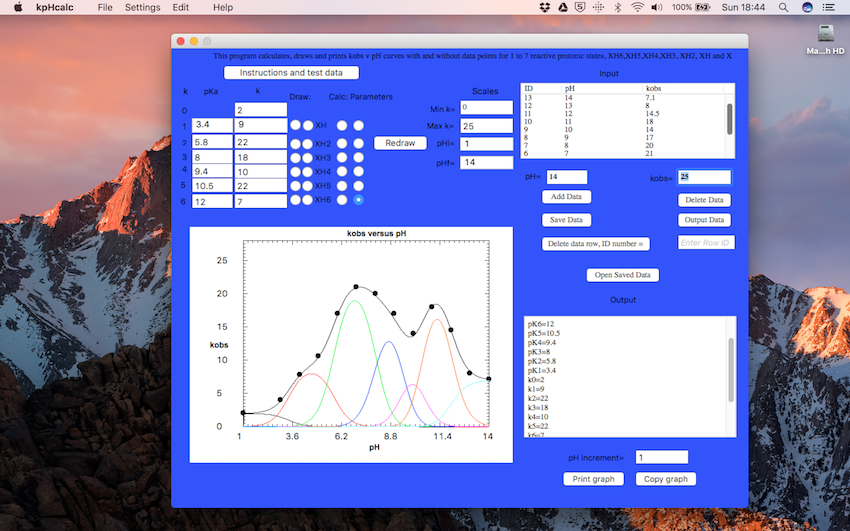
This program calculates the observed rate constant (kobs) for reactions dependent on 1 to 7 protonic states.XH6 = XH5 = XH4 = XH3 = XH2 = XH = X
The program calculates and plots the pH curves for the protonic states XH6, XH5, XH4, XH3, XH2, XH or X as well as the composite curves and experimental data. This allows you to analyze complex pH dependent manually. Graphs and calculated data can be printed or copied and pasted into applications such as Word. The analysis of pH-dependent kinetics in up to four reactive protonic states has been described (Brocklehurst & Brocklehurst 1988, 256, 556-558). The program can also be used to analyze pH dependent changes in binding constants, ppm, absorbance etc. In this case simply replace k values with the appropriate pH dependent parameters.
This program can be used to manually analyze pH data which is too complex to analyze using conventional computer fitting programs. The full equations used to calculate all the protonic states are given in "Program information". If you have pH dependent data depending on one or two pKa values you may find the following Mac applications Sigfit, Bellfit and ppmfit useful to fit the experimental data.
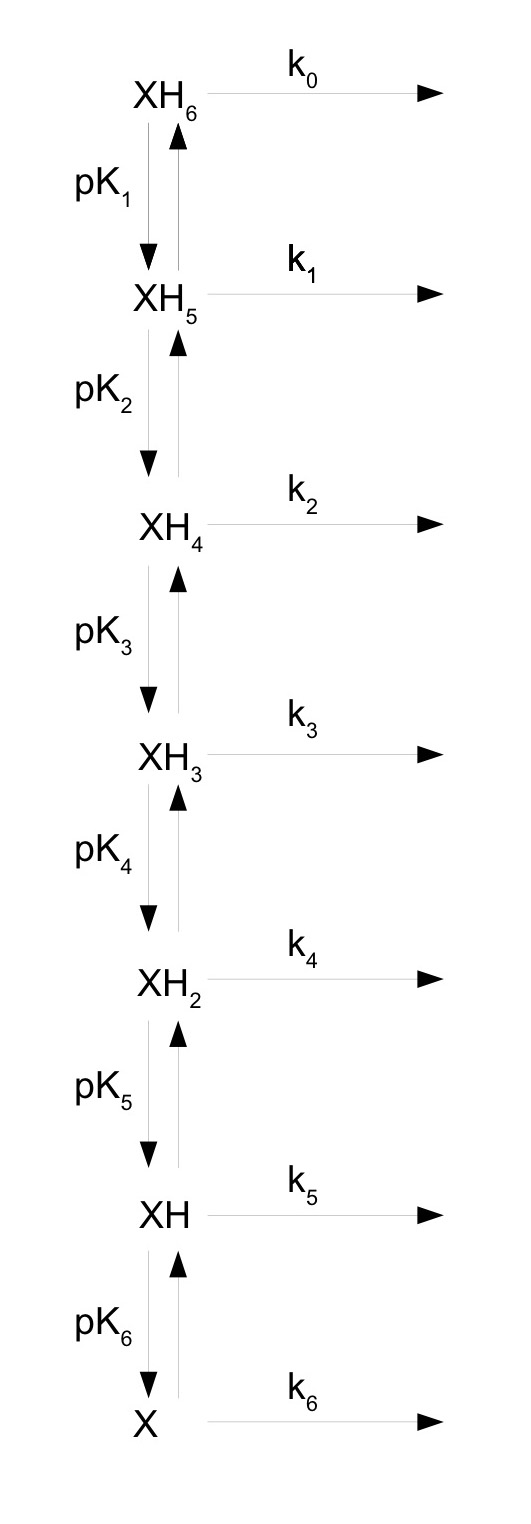
7 reactive protonic states
Instructions
pKa values and pH independent rate constants "k" are entered into the boxes on the left.
Rate constants and pKa values for the protonic states XH6,XH5,XH4,XH3,XH2,XH,X.
XH(k0,pK1), X(k1)
XH2(k0,pK1), XH (k1,pK2), X (k2)
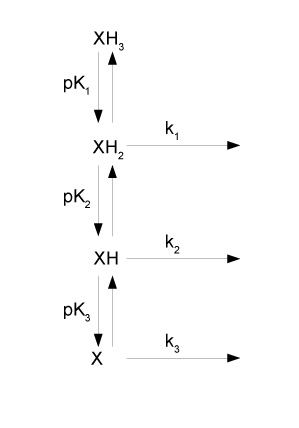
XH3(k0,pK1), XH2(k1,pK2), XH(k2,pK3), X (k3)
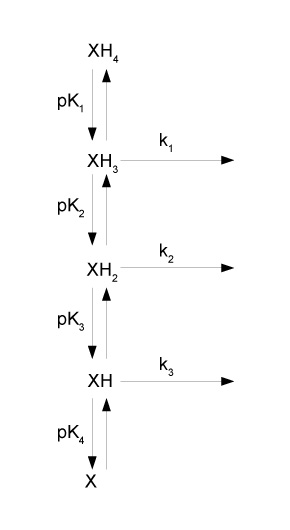
XH4(k0,pK1), XH3(k1,pK2), XH2(k2,pK3), XH (k3, pK4), X(k4)
XH5(k0,pK1), XH4(k1,pK2), XH3(k2, pK3), XH2(k3,pK4), XH(k4, pK5), X(k5)
XH6(k0,pK1), XH5(k1,pK2), XH4(k2, pK3), XH3(k3,pK4), XH2(k4,pK5), XH(k5,pK6), X(k6)
Column header: Draw
The 1st column of radiobuttons generates the pH curve for the selected protonic state(XH toXH6).
The 2nd column of radiobuttons generates the pH curve for the selected protonic state(XH toXH6) plus the component pH curves. These are useful if you are trying to manually fit pH data.
Column header: Calc
The 3rd column of radiobuttons outputs the kinetic data for the selected protonic state(XH toXH6). You can set the pH increment for the data outputted to the output window using the box below the output window.
Column header: Parameters
The 4th column of radiobuttons outputs the parameters used to calculate the graph and kinetic data for the selected protonic state(XH toXH6).
You can add experimental data as follows:-
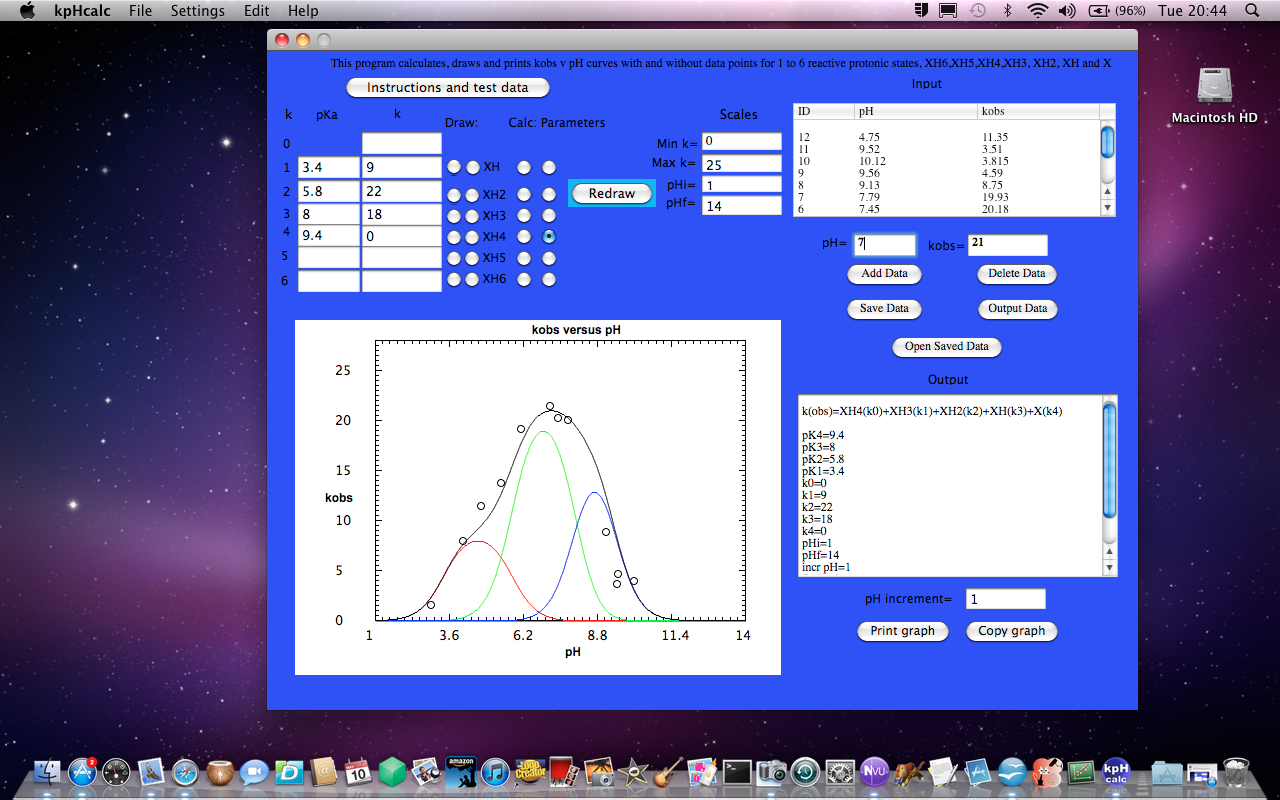
Test data
pH kobs
14 7.1
13 8
12 14.5
11 18
10 14
9 17
8 20
7 21
6 17
5 10.6
4 7.8
3 4
1 2
Enter data into the boxes "pH" and "kobs"
Press button "Add Data"
Enter data into the boxes "pH" and "kobs"
Select button "Add Data"
Repeat until all data is entered.
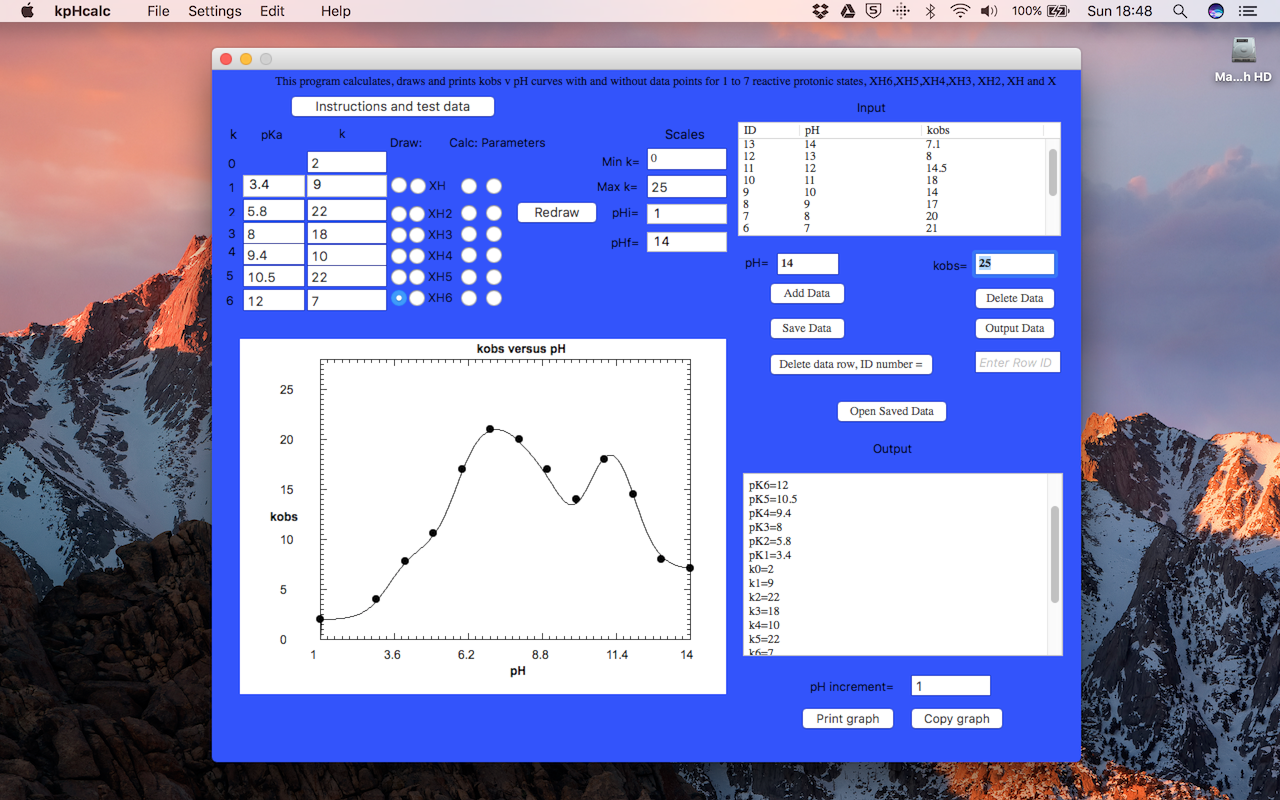
PRESS "REDRAW" TO add the data points to the graph.
Or
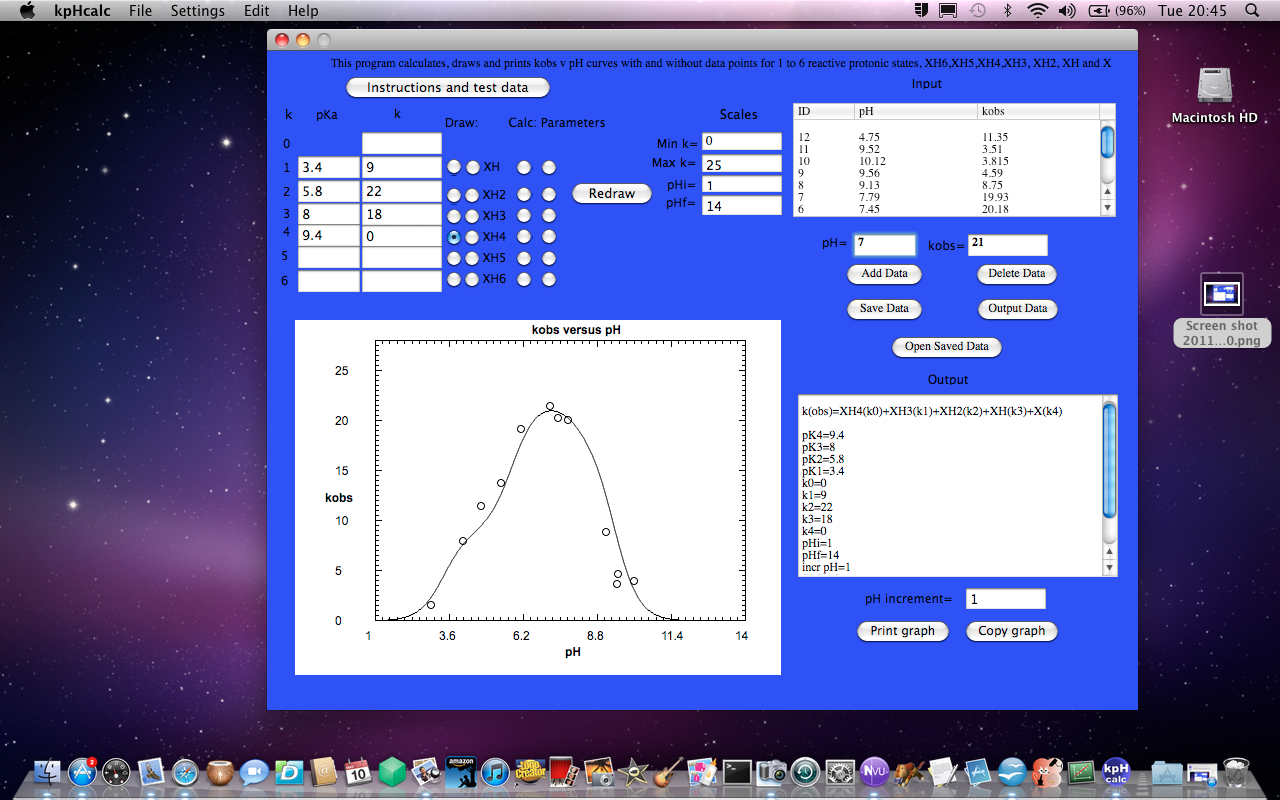
Press the "Draw" button to draw the graph you require with data points.
To remove all the data points press the "Delete data" button.
To remove one data pair enter the row ID and then select Delete data row.
Then you can save the data as a text file by selecting the "Save Data" button.
OPEN SAVED DATA
You can then reload saved data at any time by selecting "Open Saved Data".
Selecting the "output data" button outputs data to the output window. You can set the pH increment for the data outputted to the output window using the box below the output window.
If your data is in another program such as excel simply save it as a cvs file or a Tab delimited text file. If you then go to the File menu item you can select “Open cvs file” and you will be able to input data from the cvs file. To input data saved as a Tab delimited text file go to the File menu and select “Open Tab file”.
Using the default parameters you can determine the best fit by selecting the radiobuttons XH to XH6.
To change the type of data symbol and the pen width used select "Data symbols" in the settings menu
To give the graph a title and label the axes, select "Graph labels" in the settings menu and make the appropriate changes.
AFTER CHANGING THE GRAPH SCALES OR LABELS, PRESS "REDRAW" TO IMPLEMENT THE CHANGES.
Alternatively the graph can be labelled in "Preview" before printing or saving.
Select "Copy graph" to copy the graph to the clipboard. You may then paste it into other applications such as Word.
Select "Print graph" to output the graph to your printer.
If you select "Print Preview" you can save graph as png, jpg, pdf etc.
4 protonic states with 3 reactive protonic states (XH3 unreactive, ko = 0)

5 protonic states, 3 reactive protonic states